Utkarsh Pandey

Data Analyst | Marketing Analyst | Product Analyst

About Me

Utkarsh Pandey

I am a data analyst specialising in transforming complex datasets into clear, commercially actionable insights. I work across the full analytics stack, from data engineering and modelling in SQL, through statistical analysis and insight generation in Python, to interactive dashboards and data-driven narratives that help organisations make informed decisions.

With experience across multiple industries including SaaS Fintech, E-commerce, Ed-Tech, and Publishing, I have delivered analytics work spanning debt collections optimisation, marketing performance analysis, ROI audit, and product analytics.
My Projects

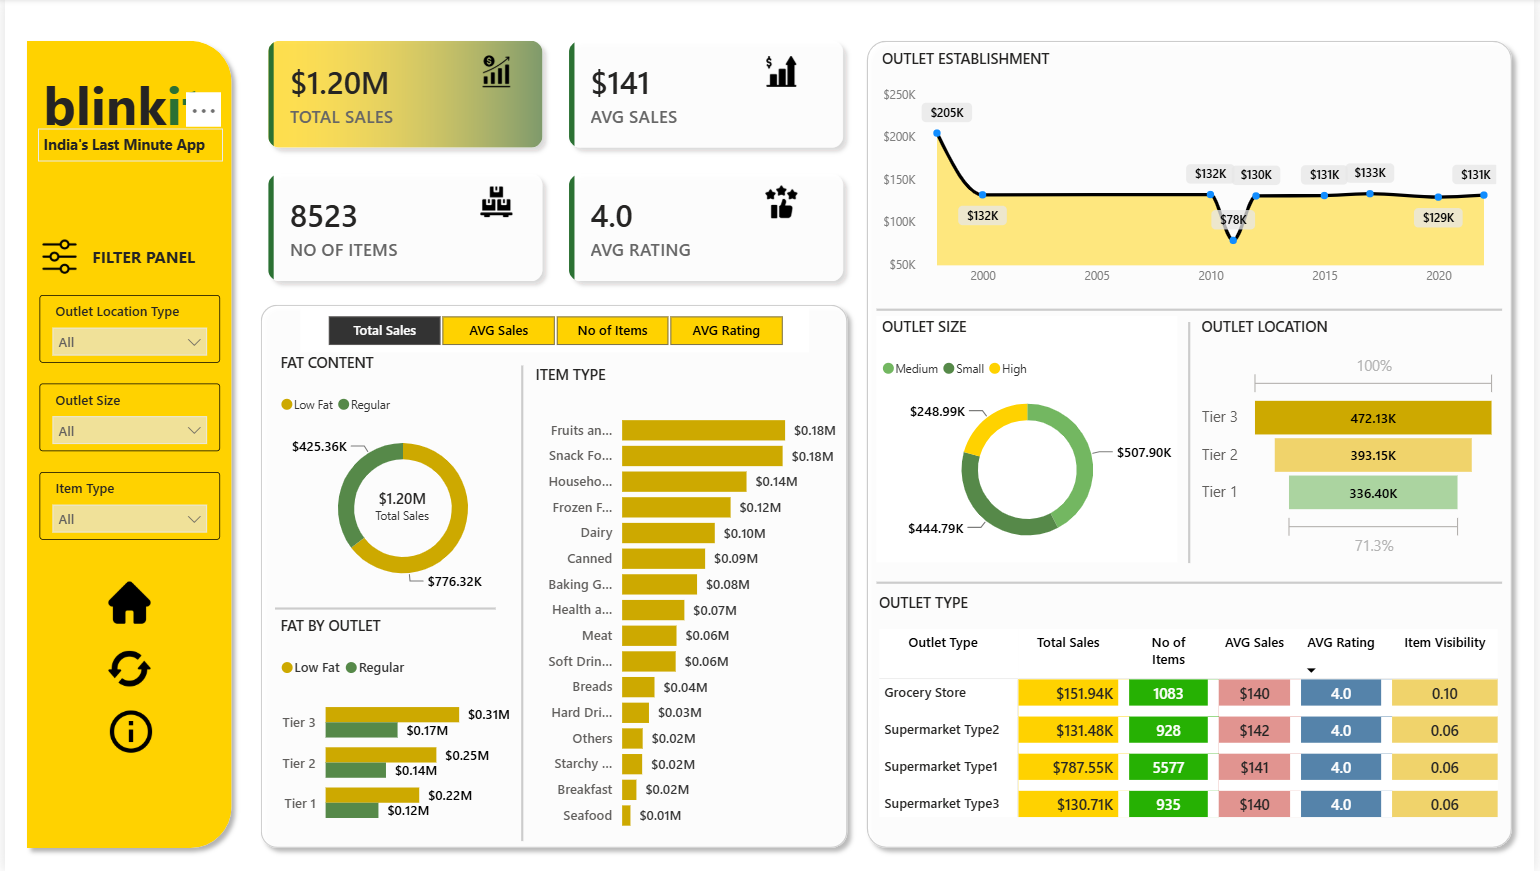
Blinkit AWS Sales Pipeline Preview

Blinkit: AWS End-to-End Sales Pipeline

End-to-end cloud data pipeline and sales analytics project built entirely on AWS, analysing Blinkit grocery sales data across multiple item categories and outlet types. Covers automated file ingestion via a scheduled SageMaker notebook, serverless querying through Athena, and a live Power BI dashboard connected via ODBC.

DebtStream Digital Collections Analysis Preview

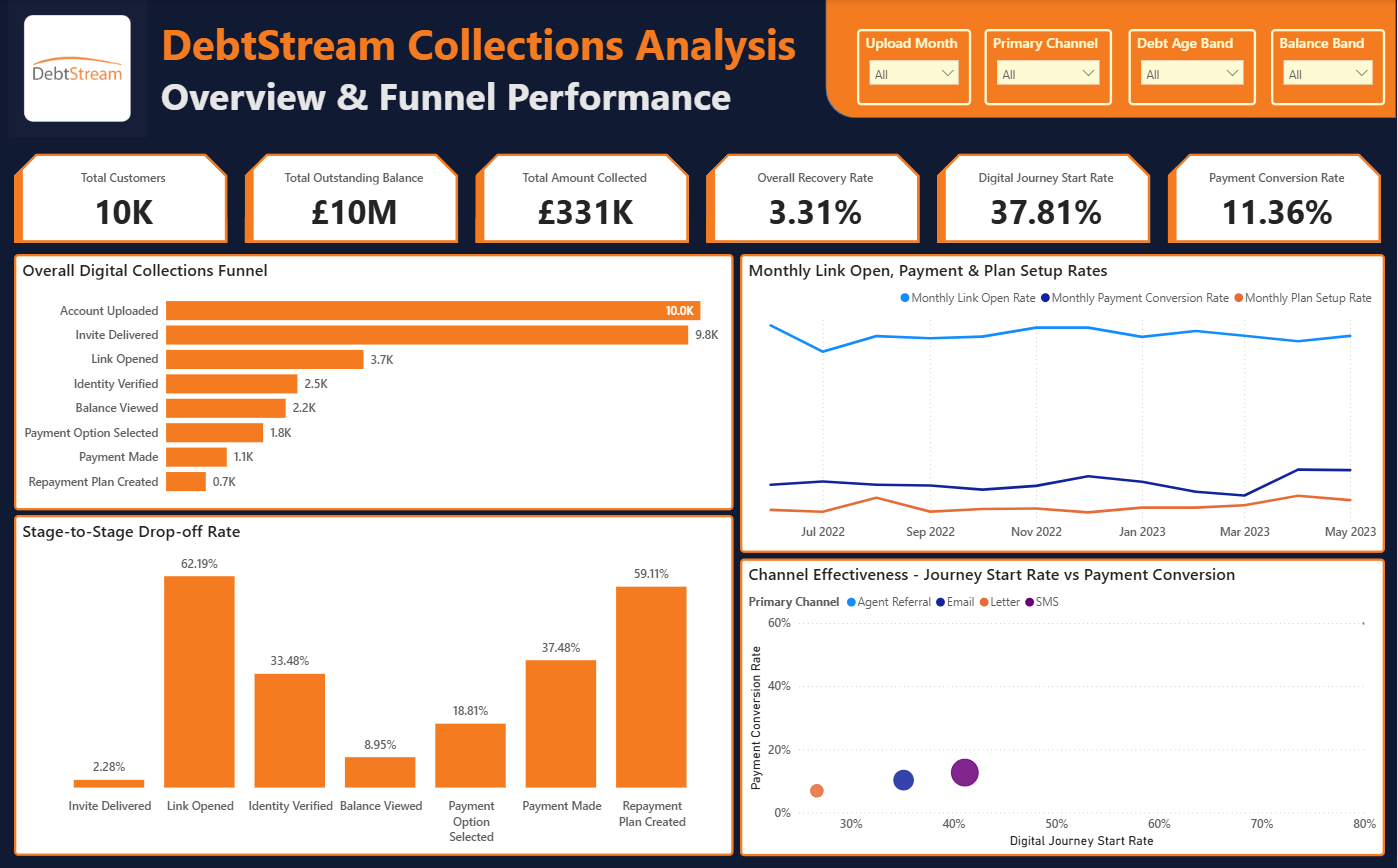
DebtStream: Digital Collections Analysis

End-to-end analytics project for a B2B fintech platform analysing 10,000 customer accounts to optimise a digital collections funnel, evaluate an SMS A/B test, and identify recovery risk segments. Built using BigQuery SQL, Python and Power BI.

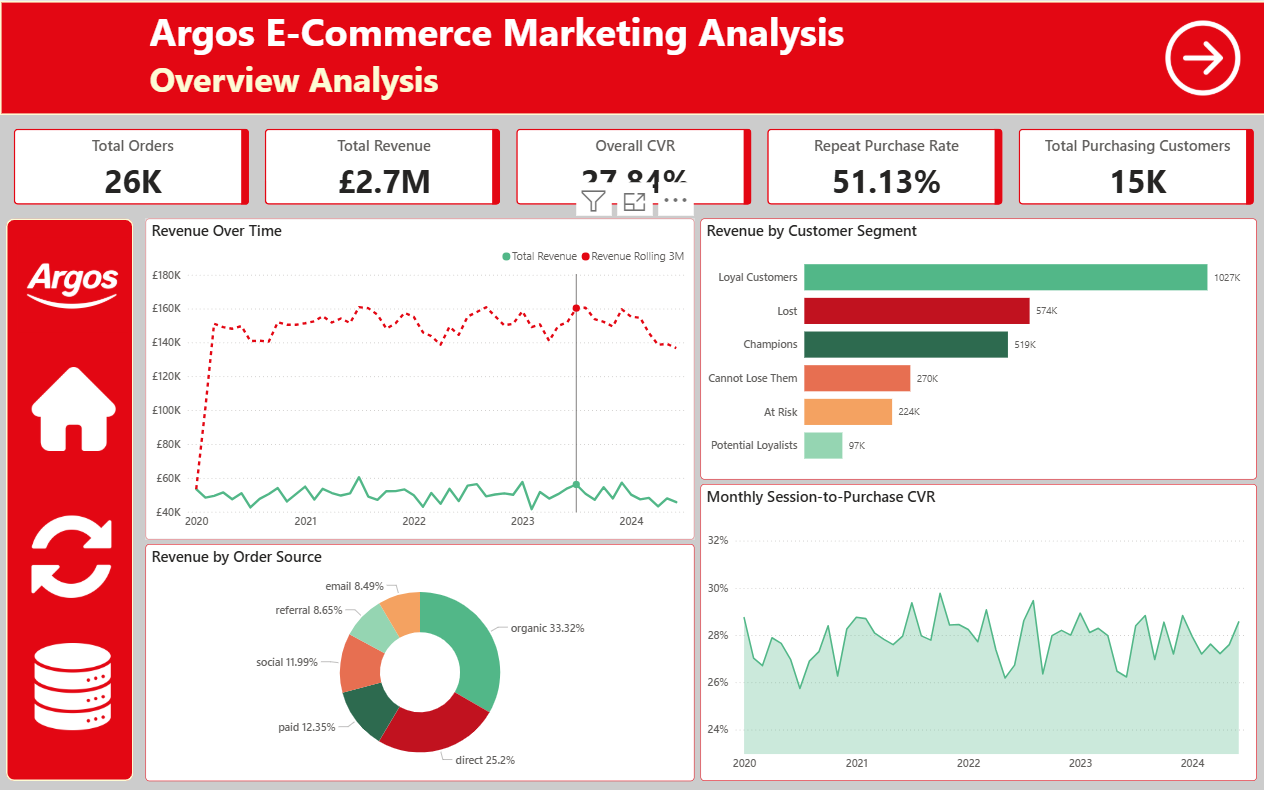
Argos E-Commerce Marketing Analysis Preview

Argos: E-Commerce Marketing Analysis

Complete end-to-end e-commerce marketing analysis for a UK-based retailer covering 4.5 years of data across funnel and conversion analysis, cohort retention and RFM customer segmentation. Built using MySQL, Python and Power BI.

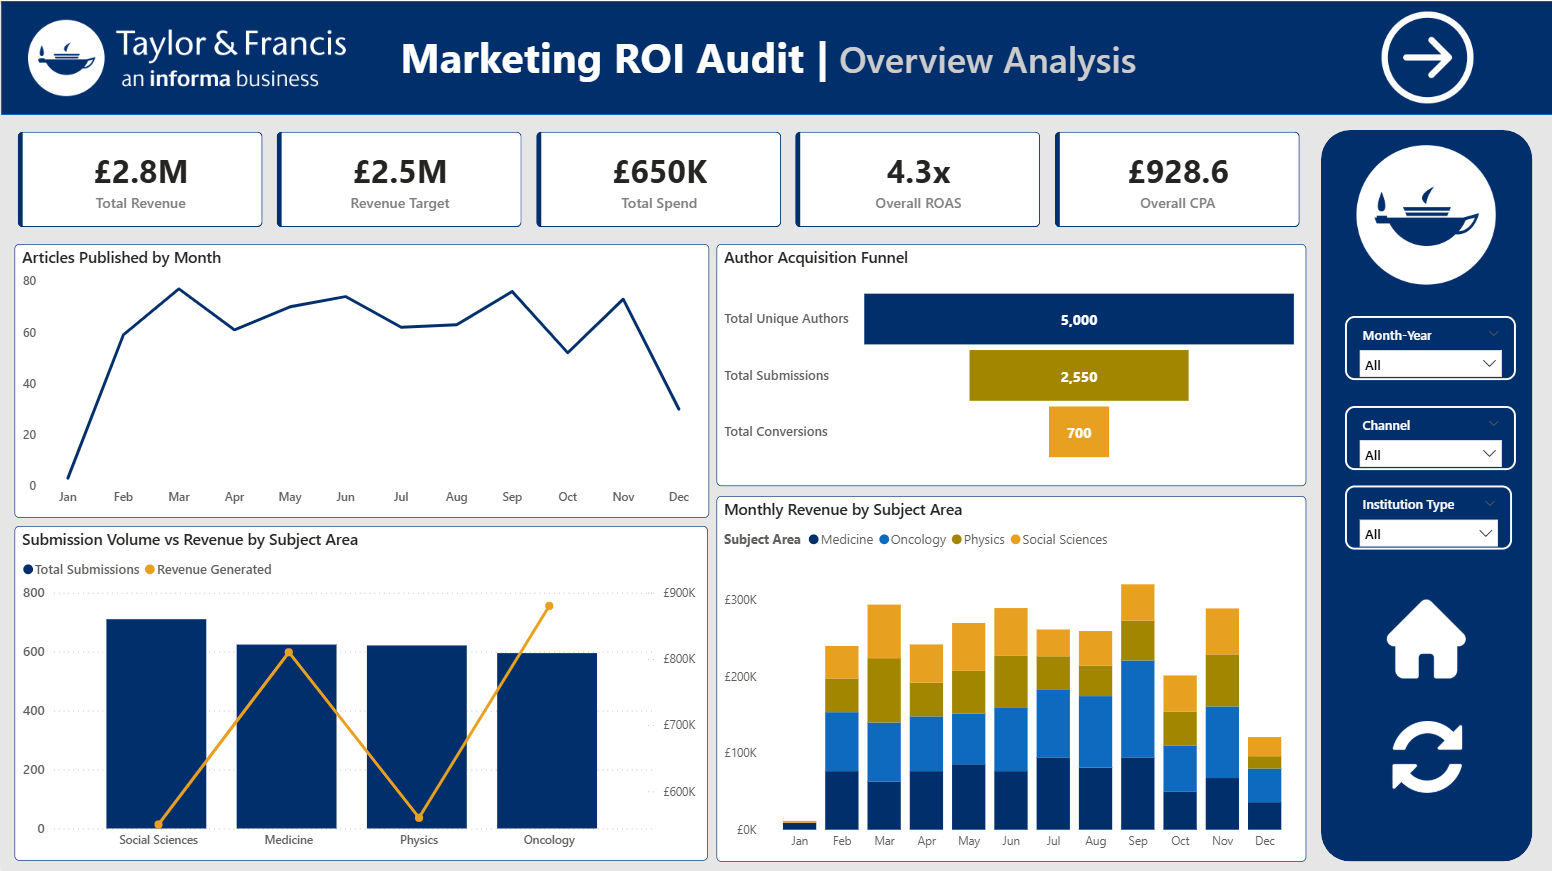
Taylor and Francis Marketing ROI Audit Preview

Taylor and Francis: Marketing ROI Audit

End-to-end marketing ROI audit for a global academic publishing firm implementing a last-touch attribution model to evaluate a £650,000 marketing investment across four channels, with K-Means clustering for audience segmentation. Built using MySQL, Python and Power BI.

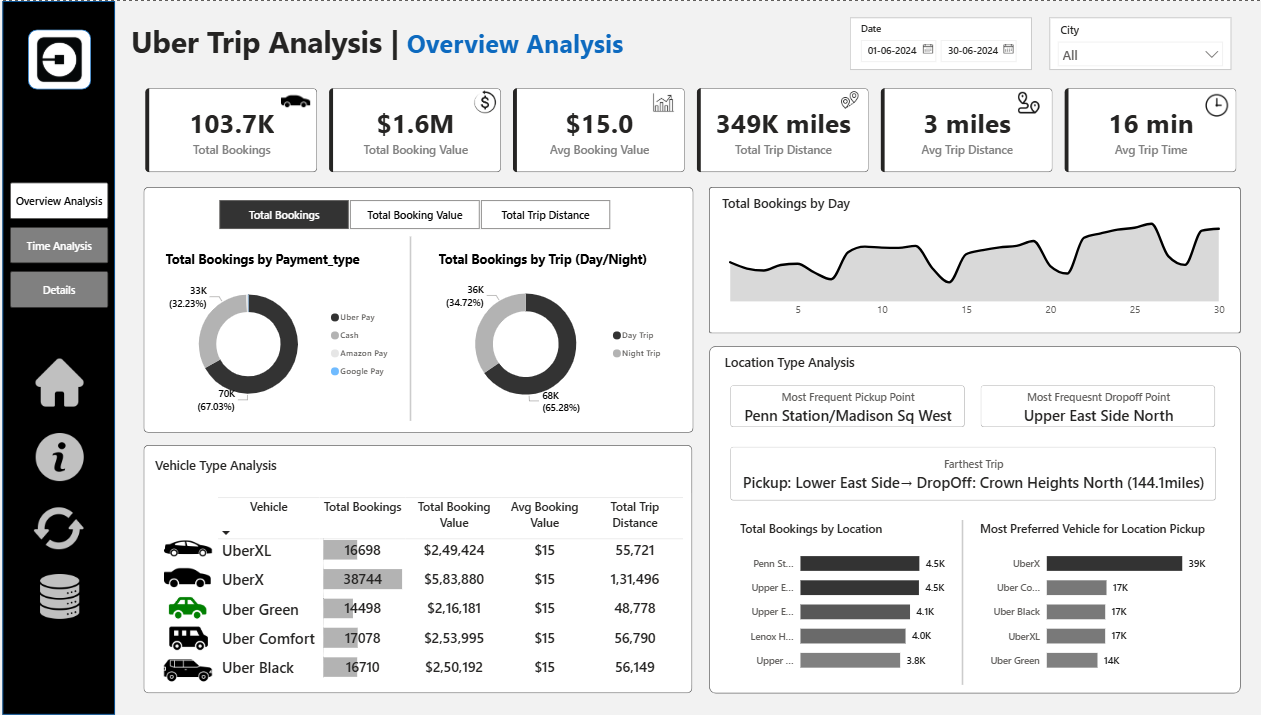
Uber Trip Analysis Power BI Dashboard Preview

Uber: Trip Analysis Dashboard

End-to-end Power BI dashboard analysing 103,728 Uber trips across New York City in June 2024. Covers booking trends, revenue and surge analysis, vehicle and payment type breakdowns, location intelligence, and time-based demand patterns using DAX measures and a dynamic field parameter slicer.

Technical Skillset

Data Visualisation

Power BI DAX Measures Matplotlib Seaborn

Data Analysis

Python (Pandas, NumPy) SQL Excel Statistical Testing AI (Claude & Codex)

Data Modeling and ETL

Star Schema Design ETL Pipelines Power Query (M)

Cloud and Data Engineering

AWS S3 AWS SageMaker AWS Athena AWS Redshift ODBC

Send me a message

Interested in collaborating or have questions about my work? I would love to hear from you.